Blog about our publication on community level tracking of COVID-19 in Ontario, Canada:
The power of data: using geospatial analysis to support COVID-19 decision-making
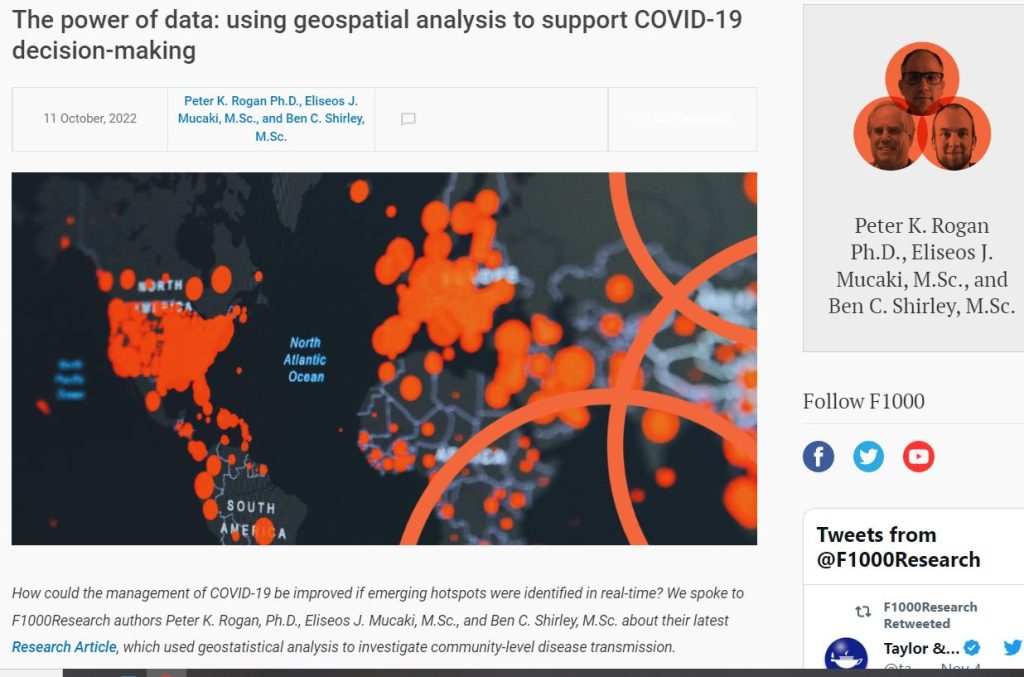

Blog about our publication on community level tracking of COVID-19 in Ontario, Canada:
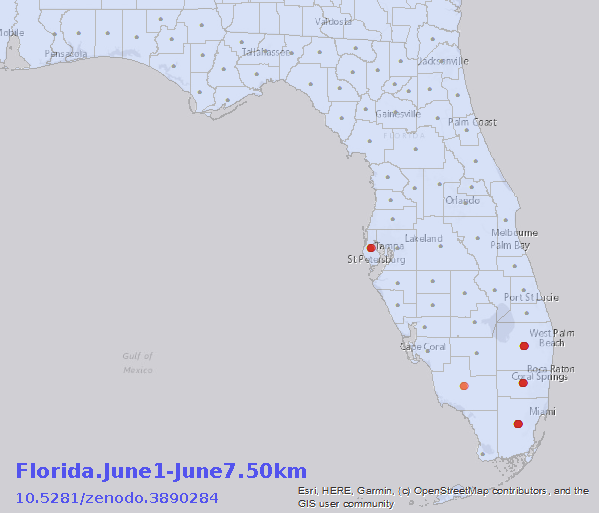
The #Omicron variant of SARS-CoV-2 spreads fast and contact tracing may prove difficult. Here is our new preprint introducing a new geostatistical approach to find disease hotspots earlier:
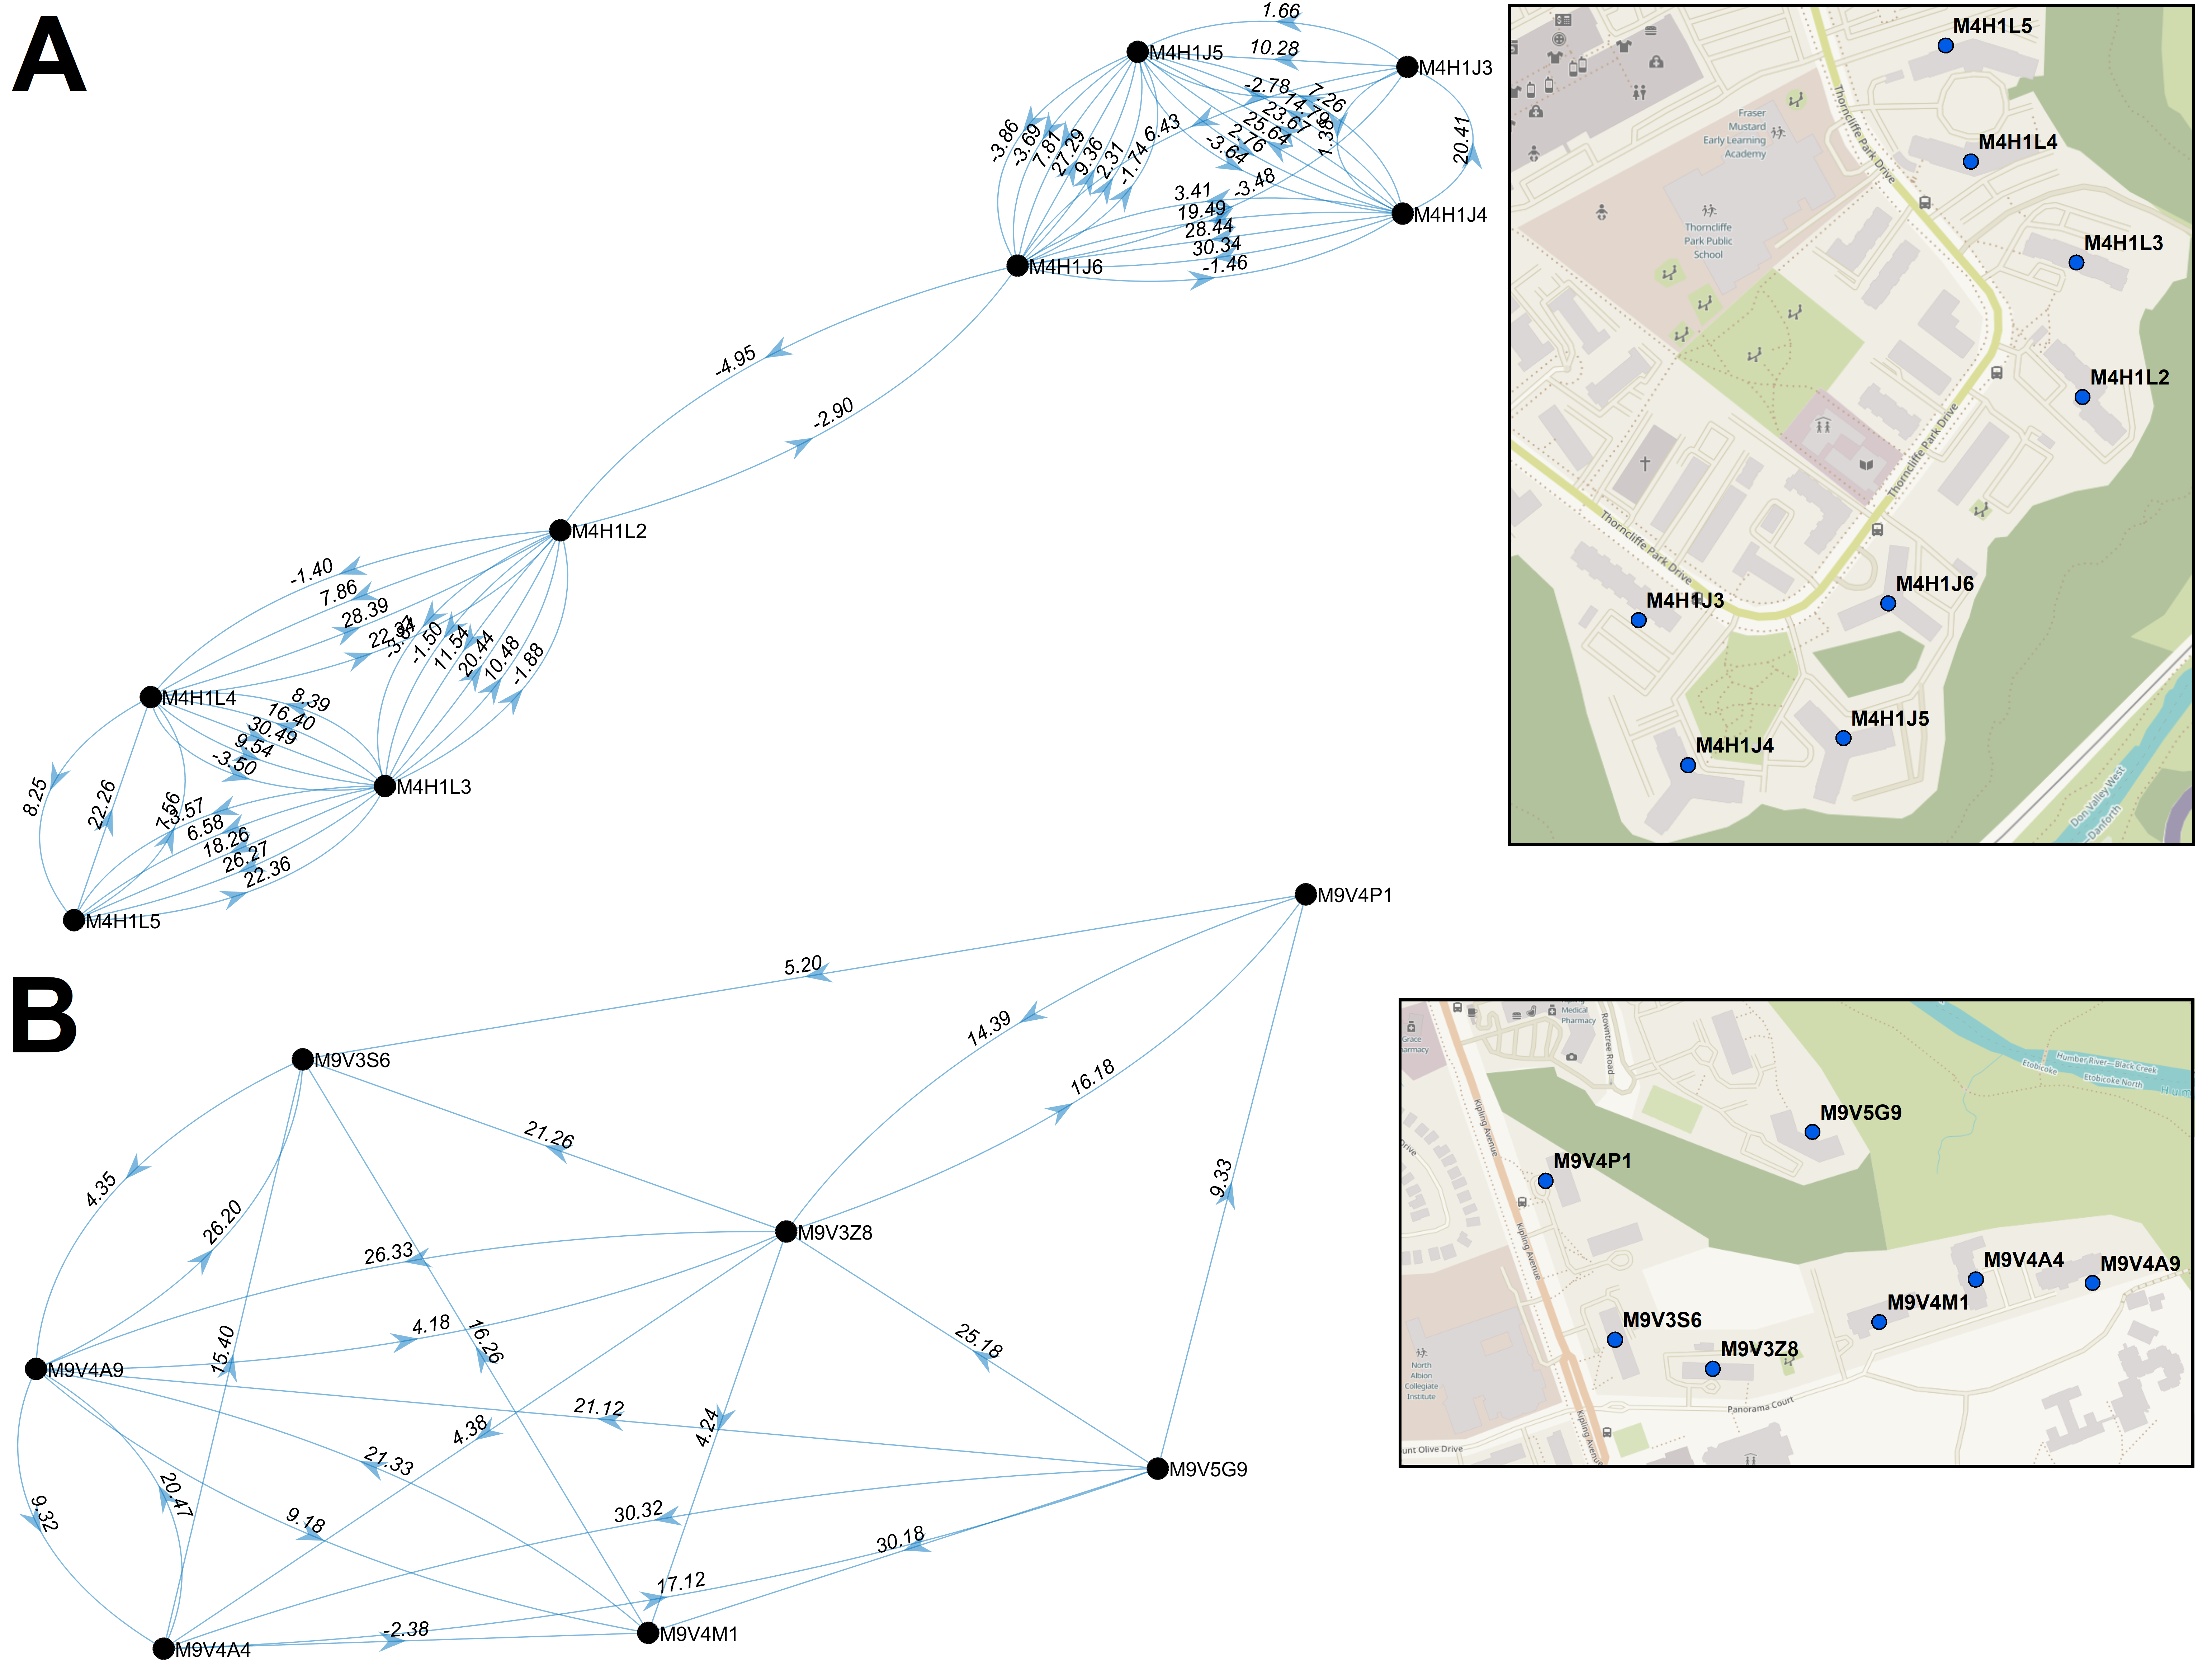
Figure 8. Multi-node Directional Networks of Closely Situated Clustered Postal Codes. Directional acyclic graphs (left) organize adjacent high-case clustered PC streaks within the same FSAs ordered according to their occurrence. Panels indicate PCs within (A) M4H and (B) M9V in Toronto during wave 2. Each connection (or ‘edge’) linking two PCs represents a pair of clustered streaks occurring within 30 days of each other (all significant PC pairs are indicated in Extended data29, Section 1 – Table S6). Labels on each edge indicate the duration (in days) separating adjacent PC pairs and the number of cases which occurred in the combined streaks (“dates.cases”). Negative values, when present, indicate the number of overlapping days of concurrent streaks in pairs of PCs. Arrows indicate the temporal order of these paired streaks (from earlier to the later streak). Maps (right) show the physical locations of each PC within the corresponding networks.